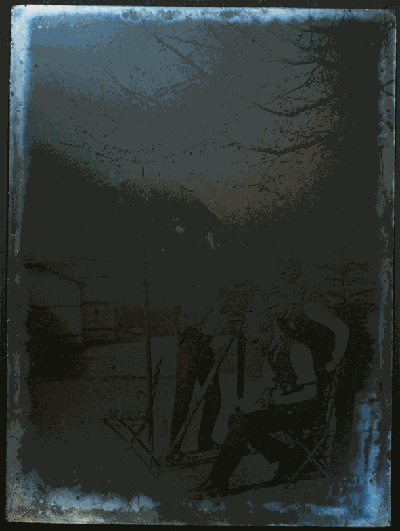
|
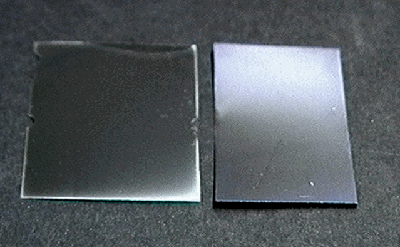
|
| Figure 1. Silver mirroring of photograph | Figure 2. Artificial silver mirroring; without (left) and with ventilation (right) |
Abstract
The product of the reaction of environmental gases with historic object is often distributed on the object surface with a characteristic pattern. If the reaction rate is fast and no convection takes place this pattern is only due to diffusion effects. Silver mirroring on silver gelatine photographs and sulphide corrosion on silver coupons are two examples of edge degradation pattern; viz. the reaction product is mostly located at the object edges. A mathematical model that predicts the formation of edge bands is proposed and the solution for a circular disk and for a flat rectangular plate are presented and compared qualitatively with experimental results.
Introduction
It is common to observe on historic objects that degradation appears with special patterns. A general characteristic of flat objects interacting with environmental gases is the presence of degradation bands located at the object edges, indicating a higher amount of reaction product in these regions. Two examples of this effect are silver mirroring and sulphide degradation on metal plates.
Silver mirroring is a surface degradation of silver gelatine photographs appearing as a bluish stain. It consists of silver and silver sulphide colloidal particles located at the surface of the emulsion. It is due to the mutual action of environmental oxidising and reducing gases attacking the silver grains embedded in the gelatine matrix. In historical samples, although silver mirroring can be present as spots or more elaborated shapes, it is almost always present as bands located at the photograph edges (fig. 1). This pattern is generally attributed to the side penetration of pollutants in the photographic stack. Nevertheless, negatives which are artificially silver mirrored by exposing them to vapours of H2O2 and H2S still show the characteristic edge bands (fig. 2 left side). This pattern can be avoided only if air is constantly ventilated during the artificial ageing (fig. 2 right side).
Sulphide corrosion of metal plates is a very common phenomenon. The characteristics of the corrosion pattern evolving when silver objects are exposed to sulphur vapours have been studied extensively in this century. When silver coupons are exposed to hydrogen sulphide, the black silver sulphide stain is concentrated at the edge [2]. Recent measurements [3] have shown that the black tarnish layer on silver coupons is indeed thicker at the corners of the coupon than at the centre.
In this paper the mechanism underlying the formation of edge degradation patterns will be investigated and a mathematical model predicting qualitatively these patterns only on the base of gas diffusion effects will be proposed.

|

|
| Figure 1. Silver mirroring of photograph | Figure 2. Artificial silver mirroring; without (left) and with ventilation (right) |
Model
Let us consider a flat object that can react with a gas present in the surrounding atmosphere. The gas will diffuse from the environment to the object surface where it will be consumed by the reaction. We will assume that the reaction rate is so fast that every gas molecule reaching the object is immediately transformed to an inert product. The gas concentration at the object surface will, therefore, be zero. On the other hand the presence of the object does not influence the gas concentration at a certain distance, which stays constant and equal to the environmental value c1 (g cm-3). This concentration profile will be attained after a relatively short time, because gas diffusion is a fast process in comparison with the formation of degradation patterns and will not change in time during the pattern formation. Degradation patterns are due to differences in the amount of reaction product on the object surface. With the hypothesis that the reaction is fast, the amount of reaction product formed per unit area and time will depend only on the amount of gas reaching the object surface per unit area and time, the so-called absorption rate K (g cm-2s-1). The absorption rate can be calculated with the aid of the diffusion theory. The basic principle of the diffusion theory, the Fick's Law, states that concentration differences drives diffusive flow of gas. The gas flow J (g cm-2s-1) is perpendicular to the planes of equal concentration and points towards the regions of lower concentration. Its value is found looking at the slope of the change of gas concentration:
(1) ![]()
in which D (cm2s-1) is the diffusion constant of the gas in air.
In proximity of the surface the concentration is ruled by the reaction with the object and the shape of the plane of equal concentration will follow the surface. At the certain distance the concentration is the environmental concentration and, for symmetry reasons, the planes of equal concentration will be spherical. Fick's law allows then finding the gas flow counting the number of planes of equal concentration crossing a definite volume in the space. The gas flow calculated at the object surface is the absorption rate K.
Figure 3 shows the planes of equal concentration for a flat object. At the edges the concentration differences are steeper and give rise, according to equation 1 to a higher absorption rate. In these regions the amount of reaction product formed per unit area and time will be higher than at the centre, resulting in the edge pattern.
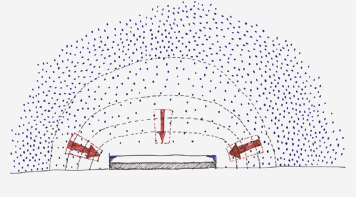
Figure 3. Planes of equal concentration for a flat object
Mathematical formulation
In order to calculate the steady state concentration profile of a gas surrounding a reacting circular disk or rectangular plate some simplifications are considered.
The concentration profile is found solving the steady state diffusion equation
(2)
![]()
with boundary conditions
(3)
![]()
The absorption rate is then calculated applying Fick's law (equation 1) at the object surface.
In the case the object is a circular disk problem equations 2 and 3 can be solved analytically, while if it is a flat rectangular plate a numerical solution can be given.
Flat circular disk
The problem is solved in the case the object is an oblate spheroid, a slightly different geometry from a circular disk. The absorption rate K (g cm-2s-1) for a flat disk of radius a (cm) is then found with a limiting procedure from the absorption rate of the oblate spheroid [3]:
(4)

where D (cm2s-1) is the diffusion constant of the gas in air and c1(g cm-3) is the environmental gas concentration.
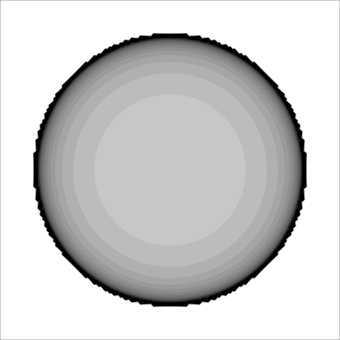
The absorption rate attains the value 2Dc1/(p a) at the centre of the plane and diverges approaching the edge. Nevertheless the total amount of gas entering the disk per unit time, the so-called total absorption rate M (s-1) is finite:
(5)
![]()
Figure 4 shows the calculated absorption rate. The Grey density of the contour plot is proportional to the absorption rate magnitude.
Flat rectangular plate
It was not possible to find an analytical solution for equations 2 and 3 if the object is a flat rectangular plate. Nevertheless it is possible to find a numerical solution with the so-called Finite Element method. The solution is found on a finite number of points in the space, the nodes of a defined grid covering the space under study. The calculation is performed with a freeware program called Tochnog [4]. Figure 5 shows the calculated absorption rate. The Grey density of the contour plot is proportional to the absorption rate magnitude.

Figure 5. Contour plot for absorption rate of flat rectangular plate
Experiment
Artificial silver mirroring formation
Silver mirroring is produced artificially by exposing photographs to vapours of an oxidising gas, e.g. hydrogen peroxide (H2O2). In order to shorten the time of formation a gas like hydrogen sulphide (H2S) can be added.
The method used in this work is a modification of the hydrogen peroxide test. Freshly processed Ilford FP4 Plus negatives are cut in strips and hanged or attached to a plastic collar placed inside a glass desiccator. Two strips of filter paper are placed on the ceramic disk and are impregnated with 0.12 ml of a 3% solution of hydrogen peroxide and 0.12 ml of a 1:10 solution of Kodak Brown Toner T8, a polysulphide solution which releases H2S. At the bottom of the desiccator a saturated solution of potassium chloride (KCl) keeps the relative humidity at 80% (Figure 6). The desiccator is closed with a plastic lid fitted with a ventilator. The jar is then placed in an oven at 50°C for some hours. The ventilator is either turned on during the first 30 minutes only or kept on during the entire exposure period.
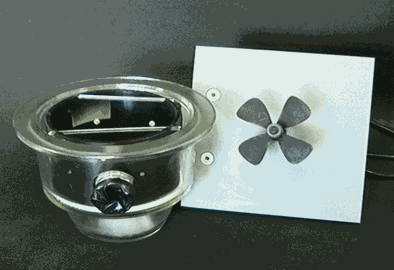
Figure 6. Experimental design
Results and Discussion
If the ventilator is turned on for the first 30 minutes only, the silver mirroring pattern is located at the edges of the negative (figure 2. left side). When ventilation is continued during the entire exposure period, silver mirroring is homogeneously distributed over the whole negative surface (figure 2. right side).
The model developed in the previous paragraph can be applied when the ventilator is switched off during most of the exposure time. In this case a gas concentration gradient builds up inside the jar, with the gas concentration being almost zero at the negative surface. The comparison between figure 2, right side, and figure 5, shows that the calculated absorption rates are in good agreement with the silver mirroring pattern developed in this case. The pattern presented in figure 5 is also similar to the sulphide corrosion pattern of silver coupons [2].
If the ventilator is kept switched on, the gas concentration is homogeneous inside the jar. This results in a homogeneous distribution of the silver mirroring over the negative surface.
Conclusion[1] L. Schaaf, Records of the dawn of photography - Talbot's Notebooks P & Q, Cambridge University Press, 1996.
[2] B. Ankersmit in this volume (presentation 7).
[3] B.T. Reagor and J.D. Sinclair, J. Electrochem. Soc.: Solid-state Science and Technology, March 1981, Vol.128, n.3, pp.:701-5.
[4] L.D.Landau, E.M.Lifshitz, Electrodynamics of Continuous Media, vol.8 of the Course of theoretical Physics, 1960, Pergamon Press, pag. 20 and solution to Problem 1 pag. 27.
[5] Tochnog is available on internet at the address: http://www.tochnog.com
[ Page up ] [ IAP Group homepage ] [ Main IAQ in Museums homepage ] [ Search site ]
Indoor Air Quality in Museums and Archives
© May 11th, 2000