IAP 1999, Presentation 7:
Bart Ankersmit
Netherlands Institute for Cultural Heritage (ICN)
The protection of silver from tarnishing: The use of silver tokens (SILPROT)
ABSTRACT
The aim of the EC-funded SILPROT project is to provide a CHEAP, SIMPLE, PRACTICAL and EFFECTIVE method for the prevention of silver tarnishing.
The research is a collaboration between:
- Oxford-Brookes University in Oxford (UK). Development, calibration and validation of H2S and SCO diffusion tubes Measurement of H2S and SCO concentration
- University of Glasgow (Scotland). Development and testing of new cobalt complexes for the chemisorption of hydrogen sulphide
- The Netherlands Institute for Cultural Heritage, ICN (NL). Measurement of the diffusion of hydrogen sulphide through polymer films to be used to encapsulate silver objects.
In the ICN part of the project silver tokens are used to evaluate the quality of different packaging methods using transparent polymer films. The tarnishing rate indicates the permeability of the pouch. Tarnishing is traditionally quantified by electrochemical measurements, weight increase and/or visual examination. In this project the colour change is evaluated using colorometry. The aims of this sub-project are:
- Evaluate the use of colour measurements to asses tarnish formation
- Carry out calibration experiments to relate colour change to degree of tarnishing
- Validate the assessment method in museum atmospheres
To evaluate the use of colour measurements the silver tokens were placed in a test chamber at 25°C and 50% RH at two different hydrogen sulphide concentrations: 280 and 400 ppb (v/v).
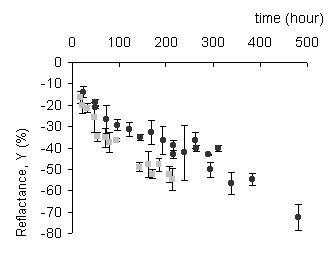
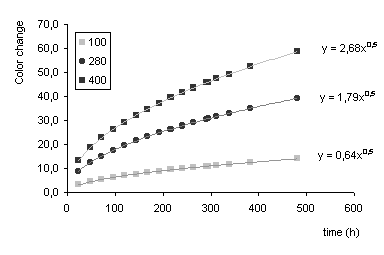
The analysis of the colour measurements indicates a drastic change in the reflectance Y (starting target Y = 98, upon tarnishing, 18<Y<98) (Figure 1a). In the L*a*b* colour space all three factors change drastically upon tarnishing: 56<L*<98 (tokens change from white to black); -0.3<a*<11 (tokens become more red); 2<b*<17 (tokens become more yellow). These L*a*b* changes are normally presented by D
E*=Ö
{(D
L*)2 + (D
a*)2 + (D
b*)2}. (Figure 1b).
Figure I: The reflectance and colour change measured by colorometry.

a) Reflectance Y vs exposure time for 280 ppb (black spheres) and 400 ppb (grey squares). The bars on each point represent the standard deviation

b) Colour change D
E vs exposure time for 280 ppb (black spheres) and 400 ppb (black squares). The predicted line for exposure at 100 ppb hydrogen sulphide is also plotted (grey squares).
A square root behaviour is found for the colour change versus exposure time. This correlates very well with the behaviour found for the weight increase (thickness of the tarnish layer) versus either hydrogen sulphide concentration or exposure time from literature data. Data analysis indicates that the points can be represented by two different lines (aÖ
x) within a 95% certainty, while the ratio of a400/a280 is comparable to the concentration ratio 400/280, thus enabling prediction of the colour change at other concentrations.

Index of presentations at IAP 1999 meeting
[ Page up ]
[ IAP Group homepage ]
[ Main IAQ in Museums homepage ]
[ Search site ]
Webmaster
Indoor Air Quality in Museums and Archives
© May 11th, 2000

