    |
Scientific and Conservation Interacion
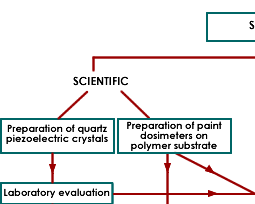
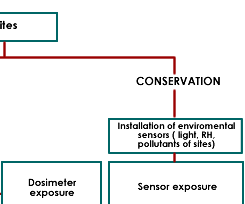
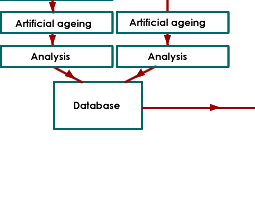
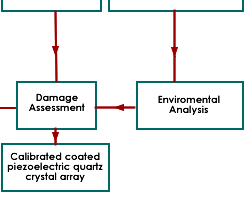
The diagram below provides an overall view of the main project. The flow chart on the left hand side (Scientific) provides the critical path for that part of the project. It will run concurrently with the right hand side (Conservation) which shows the path for the preventive conservation and environmental monitoring aspects of the project. To return to the left hand side we then go to the box designated preparation of paint dosimeters on polymer substrate. The arrow which leads from this then goes to dosimeter exposure. This links the scientific and conservation aspects of the project. After dosimeter exposure (estimate 3-9 months) this leads to the first evaluation of the paint based dosimeters and damage assessment, the main object of this project. Note that the development of the piezoelectric quartz crystals runs in parallel with the preparation and ageing of the paint dosimeters. To underpin the damage assessment further artificial ageing of paint dosimeters and PQC based dosimeters using pollutants also occurs. The results of the artificial ageing then form a database, which is vital to the damage assessment protocol. During the artificial ageing environmental data collection occurs at selected sites and this forms another database that of natural ageing under conditions which have been fully monitored (including data from passive samplers).
    |